What is a Gantt Chart
Creating Gantt Chart using MS ExceL
Project Planning : Scheduling
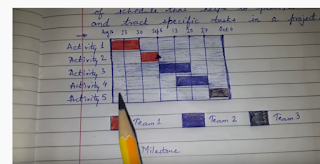
Creating Gantt Chart Manually

PERT Chart:
 GANTT Vs PERT
How to create a PERT chart
PERT creation in detail
PERT chart with milestones(days/weeks of completion of that milestone) indicated inside the node circle. As shown below:
PERT chart
 The 'letter' on the edges denote the task names, while the arrows indicate the flow of tasks.
In yet another example below, we also have mentioned the duration of each task along with their names in parenthesis

Creating Gantt Chart using MS ExceL
Project Planning : Scheduling
Creating Gantt Chart Manually


PERT Chart:

How to create a PERT chart
PERT creation in detail
PERT chart with milestones(days/weeks of completion of that milestone) indicated inside the node circle. As shown below:
PERT chart

In yet another example below, we also have mentioned the duration of each task along with their names in parenthesis

.png)

No comments:
Post a Comment