Tuesday, October 29, 2019
Monday, October 28, 2019
Saturday, October 26, 2019
Friday, October 25, 2019
Thursday, October 24, 2019
Wednesday, October 23, 2019
Tuesday, October 22, 2019
Monday, October 21, 2019
Triggers in Oracle
Triggers in Oracle Vs MS SQL
Example of creating a Trigger in Oracle
Example of creating a Trigger in Oracle
CREATE OR REPLACE TRIGGER Print_salary_changes
  BEFORE DELETE OR INSERT OR UPDATE ON emp
  FOR EACH ROW
WHEN (NEW.EMPNO > 0)
DECLARE
    sal_diff number;
BEGIN
    sal_diff  := :NEW.SAL  - :OLD.SAL;
    dbms_output.put('Old salary: ' || :OLD.sal);
    dbms_output.put('  New salary: ' || :NEW.sal);
    dbms_output.put_line('  Difference ' || sal_diff);
END;
Friday, October 18, 2019
Testing: Error/mistakes -> some become bugs/faults -> some cause failure
There are two main testing(test case selection) strategies :
- White box testing or Structural testing(Internal structure of the program is considered)
- Coverage based testing
- Cyclomatic complexity
- Mutation testing
- Boundary-value analysis
- Equivalence partitioning
Unit Testing Strategies - 2 IITKH
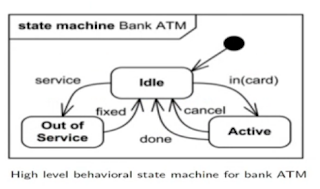
State Transition Diagram: Software Engineering
State chart diagram
https://www.youtube.com/watch?v=KBNSZp2Ysdg&feature=emb_logo
State chart diagram case study https://www.youtube.com/watch?time_continue=124&v=b_LXeysj7RY&feature=emb_logo
State machine diagram IITKH
State machine diagram of a bank ATM by IIT Kharagpur.
Example 1:
Example 2
Example 2
Example 3

https://www.youtube.com/watch?v=KBNSZp2Ysdg&feature=emb_logo
State chart diagram case study https://www.youtube.com/watch?time_continue=124&v=b_LXeysj7RY&feature=emb_logo
State machine diagram IITKH
State machine diagram of a bank ATM by IIT Kharagpur.
Example 1:
Example 2
Example 2
Example 3

Thursday, October 17, 2019
Python: Plotting graphs
Plot graph g(t) = (t^2, t^3 - t) for t(-2,2)
import matplotlib.pyplot as mp
import numpy as np
#Domain
t = np.arange(-2,2,0.001)
# create lists x and y which have all the values of x and y for the given domain
x = []
y = []
for i in t:
x = x + [i*i]
y = y + [i*i*i -3*i]
mp.plot(x, y)
#mp.show()
# naming the x axis
mp.xlabel('x - axis')
# naming the y axis
mp.ylabel('y - axis')
# giving a title to my graph
mp.title('')
# function to show the plot
mp.show()
Output:
You can practice python at colab
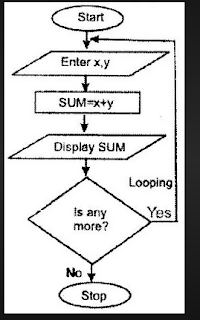
System Flow Chart
Understanding System flow chart
System flow chart is not a flow chart for an algorithm.
Sample system flow chart
Monday, October 14, 2019
DFD in Software Engineering
How to build a DFD
DFD modelling technnique
DFD basics
Building blocks of a DFD
How DFD works:
next
finally
DFD rules:
DFD levels:
Level 0 or context diagram: Write the name of the software in just one circle, then draw all system users and connect them to the system.
Example 1: Context level DFD for a tic-tac-toe game we often play
here the player INPUTS his moves and the system OUTPUTS display.
Example 2
Level 2
Example 1
Example 2
Level 3
Synchronous processes: Two processes are connected directly through a arrow
Asynchronous processes : Two processes are connected via a DATA STORE
Output of the system such as a 'printout or display' is shown by a paralellogram
DFD modelling technnique
DFD basics
Building blocks of a DFD
How DFD works:
next
finally
DFD rules:
DFD levels:
Level 0 or context diagram: Write the name of the software in just one circle, then draw all system users and connect them to the system.
Example 1: Context level DFD for a tic-tac-toe game we often play
here the player INPUTS his moves and the system OUTPUTS display.
Example 2
Level 0
Level 1
example1
example2
Example 1
Example 2
Level 3
Synchronous processes: Two processes are connected directly through a arrow
Asynchronous processes : Two processes are connected via a DATA STORE
Output of the system such as a 'printout or display' is shown by a paralellogram
Saturday, October 12, 2019
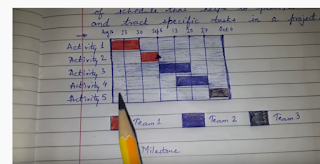
Gantt Chart and Pert Chart: Software Engineering Project Scheduling
What is a Gantt Chart
Creating Gantt Chart using MS ExceL
Project Planning : Scheduling
Creating Gantt Chart Manually
PERT Chart:
GANTT Vs PERT
How to create a PERT chart
PERT creation in detail
PERT chart with milestones(days/weeks of completion of that milestone) indicated inside the node circle. As shown below:
PERT chart
The 'letter' on the edges denote the task names, while the arrows indicate the flow of tasks.
In yet another example below, we also have mentioned the duration of each task along with their names in parenthesis
Friday, October 11, 2019
Thursday, October 10, 2019
SQL: We need JOINS to fetch combined info from two tables connected by foreign key(s)
Here is an example:
Using the AND operator in the WHERE clause to get a value from both tables each, as shown in query below:
Inserting date in Oracle table, for doing that we need to use the TO_DATE function like: TO_DATE('12/01/2016', 'DD/MM/YYYY'), as shown in example below:
Then SELECT for a specific DATE as given below:
----------------------------------------------------------------------------------------------------------------------
To get 'weekly' data (sum/count) :
suppose there is a 'sales' table having a 'sold_date' field, then
SELECT product_name, SUM(price) FROM sales WHERE sold_date <= (sysdate) AND sold_date >= (sysdate - 7);
Similarly for generating Monthly reports
SELECT product_name, SUM(price) FROM sales WHERE sold_date <= (sysdate) AND sold_date >= (sysdate - 30);
-------------------------------------------------------------------------------------------------------------
We can have multiple AND operator in a SQL query
-----------------------------------------------------------------------------------------------------------
Understanding SQL Transactions
-----------------------------------------------------------------------------------------------------------
You can PRINT text in Oracle using AS clause:
Oracle 11g Database: Online terminal to practice SQL
Oracle 11g Database terminal online
The tables ones created here remains there for ever, so never forget the names of the tables created by you here, else you will not be able to access it again.
If you remember the table names created by you , you can use it again any time in future.
Example I created a table names 'studentsCSE'
I must remember the name 'studentsCSE' to use it again anytime in future.
Once you write a command, then comment that line by prefixing '--', if you do not want that command to be re-executed along with the new commands, in the current execution.
Wednesday, October 9, 2019
Wednesday, October 2, 2019
Subscribe to:
Comments (Atom)
-
//The HTML index page <!DOCTYPE html> <!-- To change this license header, choose License Headers in Project Properties. To change ...
-
Here are some links to online work sites https://www.upwork.com/ https://www.guru.com/ https://studio.envato.com/freelance-switch/ htt...
-
Acronym Full Form AJAX Asynchronous JavaScript and XML API Application Programming Interface APK Android Application Package ASP Activ...


.png)
