Saturday, December 28, 2019

PDF: probability density function

Decision Surface/Boundary problem in Statistical Classification


https://en.m.wikipedia.org/wiki/Decision_boundary

In machine learning and statisticsclassification is the problem of identifying to which of a set of categories (sub-populations) a new observation belongs, on the basis of a training set of data containing observations (or instances) whose category membership is known. Examples are assigning a given email to the "spam" or "non-spam" class, and assigning a diagnosis to a given patient based on observed characteristics of the patient (sex, blood pressure, presence or absence of certain symptoms, etc.). Classification is an example of pattern recognition.
In the terminology of machine learning,[1]classification is considered an instance of supervised learning, i.e., learning where a training set of correctly identified observations is available. The corresponding unsupervised procedure is known as clustering, and involves grouping data into categories based on some measure of inherent similarity or distance.
Often, the individual observations are analyzed into a set of quantifiable properties, known variously as explanatory variables or features. These properties may variously be categorical (e.g. "A", "B", "AB" or "O", for blood type), ordinal (e.g. "large", "medium" or "small"), integer-valued (e.g. the number of occurrences of a particular word in an email) or real-valued (e.g. a measurement of blood pressure). Other classifiers work by comparing observations to previous observations by means of a similarity or distance function.
An algorithm that implements classification, especially in a concrete implementation, is known as a classifier. The term "classifier" sometimes also refers to the mathematical function, implemented by a classification algorithm, that maps input data to a category.
Terminology across fields is quite varied. In statistics, where classification is often done with logistic regression or a similar procedure, the properties of observations are termed explanatory variables (or independent variables, regressors, etc.), and the categories to be predicted are known as outcomes, which are considered to be possible values of the dependent variable. In machine learning, the observations are often known as instances, the explanatory variables are termed features (grouped into a feature vector), and the possible categories to be predicted are classes. Other fields may use different terminology: e.g. in community ecology, the term "classification" normally refers to cluster analysis, i.e., a type of unsupervised learning, rather than the supervised learning described in this article.

Relation to other problems

Frequentist procedures

Bayesian procedures

Binary and multiclass classification

Feature vectors


Linear classifiers

Monday, October 21, 2019

Triggers in Oracle

Triggers in Oracle Vs MS SQL


Example of creating a Trigger in Oracle

CREATE OR REPLACE TRIGGER Print_salary_changes
  BEFORE DELETE OR INSERT OR UPDATE ON emp
  FOR EACH ROW
WHEN (NEW.EMPNO > 0)
DECLARE
    sal_diff number;
BEGIN
    sal_diff  := :NEW.SAL  - :OLD.SAL;
    dbms_output.put('Old salary: ' || :OLD.sal);
    dbms_output.put('  New salary: ' || :NEW.sal);
    dbms_output.put_line('  Difference ' || sal_diff);
END;

Friday, October 18, 2019

Testing: Error/mistakes -> some become bugs/faults -> some cause failure

There are two main testing(test case selection) strategies :

  1. White box testing or Structural testing(Internal structure of the program is considered)
  • Coverage based testing
  • Cyclomatic complexity
  • Mutation testing
   2. Black box testing or Functional testing (The internal structure of the program is ignored, and attempt is to analyze the code , which produces the outputs for the given input values).
  • Boundary-value analysis
  • Equivalence partitioning                                                                                                                                
Unit Testing Strategies - 1 IITKH

Unit Testing Strategies - 2 IITKH

State Transition Diagram: Software Engineering

State chart diagram
 https://www.youtube.com/watch?v=KBNSZp2Ysdg&feature=emb_logo

State chart diagram case study https://www.youtube.com/watch?time_continue=124&v=b_LXeysj7RY&feature=emb_logo

State machine diagram IITKH

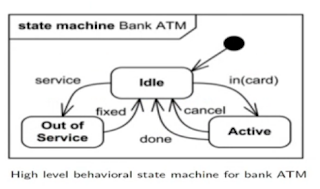
State machine diagram of a bank ATM by IIT Kharagpur.

Example 1:


Example 2


Example 2


Example 3

Thursday, October 17, 2019

Python: Plotting graphs

Plot  graph g(t) = (t^2, t^3 - t) for t(-2,2)

import matplotlib.pyplot as mp
import numpy as np
#Domain
t = np.arange(-2,2,0.001)
# create lists x and y which have all the values of x and y for the given domain
x = []
y = []

for i in t:
  x = x + [i*i]
  y = y + [i*i*i -3*i]
mp.plot(x, y)
  #mp.show()

# naming the x axis
mp.xlabel('x - axis')
# naming the y axis
mp.ylabel('y - axis')

# giving a title to my graph
mp.title('')

# function to show the plot
mp.show()

Output:
You can practice python at colab


System Flow Chart


Understanding System flow chart


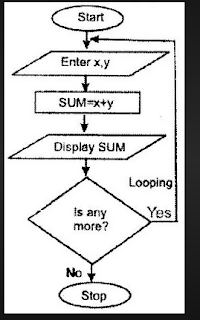
System flow chart is not a flow chart for an algorithm.

Sample system flow chart


Monday, October 14, 2019

DFD in Software Engineering

How to build a DFD
DFD modelling technnique
DFD basics

Building blocks of a DFD


How DFD works:

next

finally


DFD rules:

DFD levels:

Level 0 or context diagram: Write the name of the software in just one circle, then draw all system users and connect them to the system.

Example 1: Context level DFD for a tic-tac-toe game we often play


here the player INPUTS his moves and the system OUTPUTS display.

Example 2


Level 0


Level 1


 example1 


example2

Level 2

Example 1

Example 2
Level 3


Synchronous processes: Two processes are connected directly through a arrow


Asynchronous processes : Two processes are connected via a DATA STORE


Output of the system such as a 'printout or display' is shown by a paralellogram


Burst Time of a CPU: OS fundamentals

Saturday, October 12, 2019

Activity Diagram

Gantt Chart and Pert Chart: Software Engineering Project Scheduling

What is a Gantt Chart

Creating Gantt Chart using MS ExceL

Project Planning : Scheduling

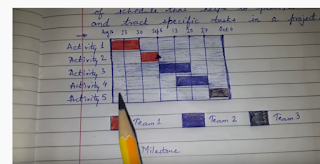
Creating Gantt Chart Manually


PERT Chart:

GANTT Vs PERT

How to create a PERT chart
PERT creation in detail

PERT chart with milestones(days/weeks of completion of that milestone) indicated inside the node circle. As shown below:
PERT chart
 The 'letter' on the edges denote the task names, while the arrows indicate the flow of tasks.

In yet another example below, we also have mentioned the duration of each task along with their names in parenthesis


Thursday, October 10, 2019

SQL: We need JOINS to fetch combined info from two tables connected by foreign key(s)

Here is an example:

Using the AND operator in the WHERE clause to get a value from both tables each, as shown in query below:

Inserting date in Oracle table, for doing that we need to use the TO_DATE function like: TO_DATE('12/01/2016', 'DD/MM/YYYY'), as shown in example below:
Then SELECT for a specific DATE as given below:

----------------------------------------------------------------------------------------------------------------------
To get 'weekly' data (sum/count) :

suppose there is a 'sales' table having a 'sold_date' field, then

SELECT product_name, SUM(price) FROM sales WHERE sold_date <= (sysdate) AND sold_date >= (sysdate - 7);

Similarly for generating Monthly reports

SELECT product_name, SUM(price) FROM sales WHERE sold_date <= (sysdate) AND sold_date >= (sysdate - 30);


-------------------------------------------------------------------------------------------------------------
We can have multiple AND operator in a SQL query
-----------------------------------------------------------------------------------------------------------
Understanding SQL Transactions

-----------------------------------------------------------------------------------------------------------
You can PRINT text in Oracle using AS clause:


What is a data structures

  Data structure is a tool in the hands of a programmer for  storing a large number of data items  in the main memory (RAM) of a computer wh...